Thursday, October 24, 2013

The Need for Speed

Selecting the right WAN connection can be something of an art.


Depending on the size of your organization, WAN communication costs can be a huge recurring expense.  Additionally, because WAN links are typically so much smaller than normal LAN connections, there tends to be a desire to get the most bandwidth (biggest "pipe") possible.   Finally, sometimes we have difficulty finding a carrier to offer our desired service for a given address.  The combination of cost, bandwidth, and availability are key factors that go into our final selection of a WAN circuit.  


When selecting a WAN circuit, a critical element that is often overlooked is latency.  Latency is the concept of how long did the task take to complete.  


The example above is from a cable modem connection.  Although the connection averages 17 Mbps download, and 5 Mbps upload, the latency is almost 10 times worse than a normal T1 / MPLS connection.  When you add the overhead of VPN to the connection, the latency can easily push up to a 90ms average.

We recently converted some WAN sites from cable modem / VPN to MPLS.  The following chart illustrates the latency times before and after the conversion.


Some computing tasks are more time sensitive than others.  If your environment is attempting to push time sensitive traffic like VOIP or virtual desktops across a WAN link, you need to pay very close attention to latency.  


Monday, October 21, 2013

Visualize the Flow

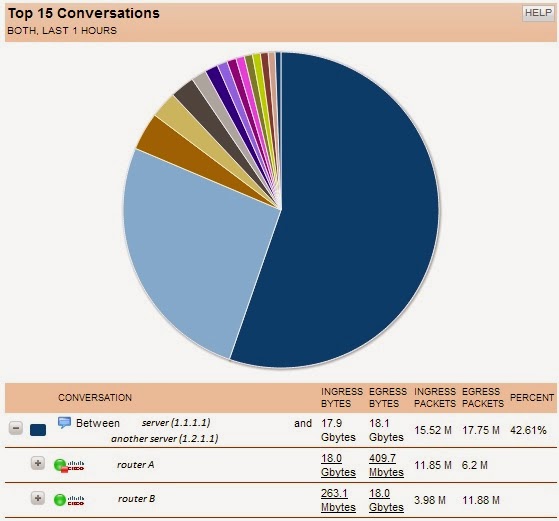
Understanding what is flowing across the network is essential.  Products like Solarwinds Netflow Traffic Analyzer help provide a view into what is (and has been) happening on the network.

With Netflow Data: IT teams can quickly zero in on what is currently impacting performance.  

Without Netflow Data:  IT teams often scramble through ineffective actions like rebooting various devices. Sometimes by  guessing through the problem, IT teams can actually create additional issues.


Fortunately, gathering this information is fairly easy.  First you need to get the SolarWinds NTA product setup on one of your servers.  Afterward, the NTA site should show what port the service is listing on.  This "collection port" information is used later when setting up the devices that your want to collect NetFlow data on.


The next step is start to add points on the network that you want to monitor.  For example, if a remote T1 connected site is having recurring difficulties with WAN performance, it would be great to know what specific types of traffic is moving across the T1 connection.

Adding the device to NTA is fairly easy.  If you wanted to collect T1 connection information from the Cisco router in the example above, you simply add a few configuration lines to the router where the T1 is connected.  There are two simple parts to the addition:

  • Add the following to the base configuration of the router you want to monitor:

ip flow-export version 9
ip flow-export destination 2.2.2.2 2055     

(2.2.2.2 should be replaced with the IP address of your SolarWinds server and 2055 is the collection port of your NetFlow collector service on that server)

  • Add the following to the specific interface that you want to monitor (ex: Serial 0/0/0):
ip flow ingress
ip flow egress

There is a lot of information available on the Solarwinds NTA product, but the key point here is that setting up your devices to report this type of NetFlow data is very easy.


Friday, October 4, 2013

Rediscovering Good Ideas

Recently a teammate came up with a great idea: Create a way to quickly search the content of our Powershell script library.   Wouldn't it be great to know "which scripts reference specific servers?"   What if we had a way to determine "what scripts use the following command?" 

Although the script is fairly basic, the yield can be very powerful!


Easy to understand search

Matches displayed in a hash table


Selected script displayed in a temporary text file to avoid accidental overwrites. 

Here are the basics of the script:
    1) set the path to the library that will be searched


Thursday, October 3, 2013

Monitor APC PDUs with SolarWinds NPM

Some time ago, an unfortunate VLANing issue prevented us from accessing the metered power distribution units (PDU) at our data center.  Recently we resolved the original VLAN issue and I decided to take the time to get the PDUs back onto the network.  

Once the PDU were back on the network, it seemed like a good idea to use our monitoring software, Solarwinds NPM, to make sure the units were working correctly, and that they were not overloaded.

Now that the work is complete, we can view the current load (and trend) of a PDU.  Additionally we get email alerts when a PDU exceeds a safe AMP load.


This project had the following components:
   2) Add the units to SolarWinds for SNMP monitoring (basic task for users of the product)